
Reliability is the only major driver of plant economics that most manufacturers still manage as a cost center and report as an anecdote. Energy has a price per kilowatt-hour, raw material has a contract, labor has a rate, but the mechanical integrity of the asset base, the thing that decides whether the other three convert into shipped product, appears nowhere on a financial statement until it fails. This article proposes a corrective: a reliability balance sheet, a defensible mathematical framework that translates machine condition into protected earnings, avoided capital, and energy recovered, in the currency boards actually use. It covers the math that connects a vibration trend to EBITDA, the three places reliability hides on the income statement, why most downtime cost figures fail audit, and how the framework changes capital allocation, insurance posture, and the structure of maintenance contracts.
The Accounting Blind Spot
Walk into any plant leadership review and two conversations run in parallel without touching. In one room, finance debates margin per ton, energy surcharges, and working capital. In the other, reliability engineers debate bearing defect severities and lubrication intervals. The translation layer between them does not exist, and the absence is not neutral. It systematically starves reliability of capital, because a discipline that cannot state its value in currency loses every budget negotiation to one that can.
The root cause is that downtime cost, the number everyone quotes, is usually indefensible. The figure that circulates in most plants is a flat rate per hour, inherited from a study nobody can find, applied identically to a bottleneck asset and a spared auxiliary. Finance discounts it on sight, and they are right to. A credible number must distinguish three situations that have completely different economics. (Figure 2.) First, a constrained plant, sold out, where every lost hour is lost contribution margin forever: here downtime is valued at the margin of the product not made, and the number is enormous and real. Second, an unconstrained plant with slack capacity, where lost production is made up later: here the true cost is overtime, energy inefficiency of restart, schedule disruption, and expedited freight, a far smaller but still real figure. Third, the failure that cascades: the gearbox that takes the motor with it, the unplanned stop that scraps work in process, quality deviation on restart, the secondary damage multiplier that routinely doubles or triples the direct repair bill. A reliability balance sheet begins by refusing the flat rate and valuing each critical asset’s downtime in its own economic context: bottleneck position, sparing, product mix on the machine, and restart behavior.
There is a second blind spot, quieter and larger over time: degradation consumes energy before it consumes the machine. Misalignment, bearing wear, fouling, and partial mechanical failure all convert electrical energy into heat and vibration instead of useful work. Fleet-level studies of motor-driven systems consistently find meaningful efficiency losses attributable to mechanical condition. A plant that monitors condition continuously is also, whether it intends to or not, running an energy conservation program, and that stream of savings accrues every operating hour, not only on the day a breakdown was avoided. It is the annuity hidden inside the insurance policy.
The Framework: Five Lines of the Reliability Balance Sheet
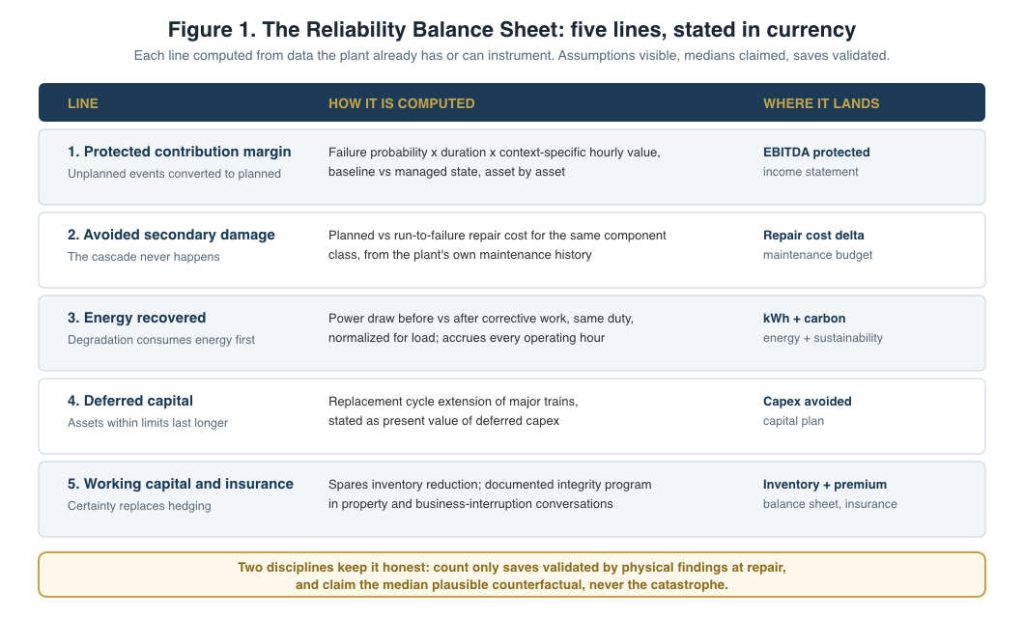
The framework states the economic position of the asset base in five lines, each computed from data the plant already has or can instrument. (Figure 1.)
Line one: protected contribution margin. For each critical asset, expected downtime cost equals failure probability over the period, times expected duration, times the asset’s context-specific hourly value as defined above. Condition monitoring and prescriptive maintenance change the first two factors: they convert high-consequence unplanned events into planned interventions that are shorter, cheaper, and scheduled into low-cost windows. The difference between the expected loss of the unmanaged baseline and the managed state is protected margin. It must be computed asset by asset, summed, and stated with its assumptions visible: this is the line auditors will attack, so build it to survive them. Use the plant’s own failure history for baseline rates where it exists; use industry failure-mode libraries where it does not, and say so.
Line two: avoided secondary damage and repair delta. A bearing replaced at stage two costs the bearing and a planned shift. The same bearing run to seizure costs the shaft, the housing, sometimes the gearbox, emergency freight for the parts, premium labor, and the cascade. Maintenance records already contain both populations; the ratio between planned and run-to-failure repair cost for the same component class, computed from the plant’s own history, is among the most persuasive numbers in the entire framework precisely because none of it is modeled.
Line three: energy recovered. Condition-driven correction of misalignment, imbalance, and fouling returns a measurable percentage of drive power. Instrument it honestly: power draw before and after corrective work on the same duty, normalized for load. Stated per year across a monitored fleet, this line alone frequently funds the monitoring program, and it carries a second meaning that boards increasingly price: every recovered megawatt-hour has a carbon figure attached, which moves the same work from the maintenance budget to the sustainability report.
Line four: deferred capital. Assets run within their physical limits, caught before secondary damage, and maintained on condition rather than on calendar, last longer. Extending the replacement cycle of a major rotating train by even a fraction defers capital expenditure that has a present value finance can compute in minutes. Reliability is the only maintenance activity that shows up as a capex line, and almost nobody claims it.
Line five: working capital and insurance. Condition knowledge shrinks the spares inventory a plant must hold against uncertainty, because uncertainty is what the inventory was hedging. And a documented, continuous mechanical-integrity program is increasingly material in property and business-interruption insurance conversations, where insurers have begun differentiating between plants that can demonstrate asset health governance and plants that cannot.
Two disciplines keep the balance sheet honest. Count only validated events: a save counts when the fault hypothesis was confirmed by the physical findings at repair, teardown photographs attached, not when an alarm merely preceded an intervention. And state counterfactuals conservatively: claim the median plausible avoided outcome, not the catastrophe. A reliability program that claims modestly and validates ruthlessly builds the credibility that survives its first leadership change. One that claims the maximum every time is a marketing document, and finance will treat it as one.
What Changes When the Number Exists
The point of the framework is not reporting. It is that four decisions change the moment reliability speaks in currency.
Capital allocation changes. Monitoring and reliability investment can now be ranked against every other project on the same return basis, instead of pleading for budget as risk mitigation. In most heavy plants the computed return on instrumenting the top two deciles of criticality is not marginally better than alternative uses of the money; it is dominant, because the downside it removes is so asymmetric. The balance sheet makes that asymmetry visible.
Prioritization changes. With every critical asset carrying its own downtime value, the monitoring rollout sequences itself: consequence times likelihood, computed, not debated. The political question of whose equipment gets instrumented first becomes an arithmetic question.
Contracts change. Once uptime has a defensible price, it can be transacted. Outcome-based reliability agreements, where a provider is paid against validated availability and savings rather than against sensors shipped or hours billed, are only possible when both sides trust the measurement. The reliability balance sheet is that measurement. The same logic is extending to how OEMs warrant equipment, how insurers price business-interruption cover, and how private owners value industrial assets at transaction: a plant that can produce three years of validated reliability accounts is, measurably, a different asset from one that cannot.
Accountability changes. A maintenance organization measured on protected margin and validated saves behaves differently from one measured on budget adherence and wrench time. The heroic 2 a.m. repair stops being the culture’s founding myth and becomes what it always was economically: the most expensive possible way to do the same work.
The framework described so far works with a clipboard and discipline. What continuous, physics-referenced condition intelligence adds is compounding. When machine state is estimated continuously rather than sampled quarterly, the balance sheet stops being an annual retrospective and becomes a live instrument: the plant’s expected-loss position, updated as the machines themselves report. Scheduling can then optimise against it daily, choosing production sequences that respect the current mechanical state of the fleet. Energy variance can be attributed to specific degrading assets in the week it appears, not the audit after. And the three-year validated history that accumulates becomes an asset in its own right at refinancing, at insurance renewal, and at sale. Reliability, managed this way, stops being the cost of owning machines and becomes part of their yield. That is what capital multiplier means here, stripped of ornament: the same iron, the same people, the same energy contract, returning more, verifiably, because the plant finally keeps honest accounts of its own mechanical health.
Retire the flat downtime rate and value every critical asset’s lost hour in its own context: constraint position, sparing, and cascade behaviour. Build the five-line reliability balance sheet with assumptions visible, claim medians not maximums, and validate every save against physical findings. Instrument energy recovery, because it pays for the program while the avoided catastrophe justifies it. Then use the number for what numbers are for: rank the capital, sequence the rollout by arithmetic, restructure at least one maintenance contract around outcomes, and measure the maintenance organisation on protected margin. The plants that keep these accounts will not merely run better. Within a few years, they will be valued differently, by their insurers, their lenders, and their buyers, than the plants that still report reliability as an anecdote.